|
|
| WRITTEN BY: CoStar Economy is produced weekly by Robert Calhoun, managing director and senior economist, and Matt Powers, associate director of CoStar Market Analytics in New York City.
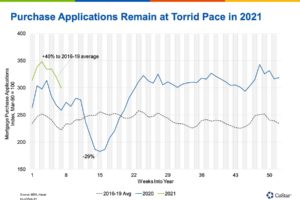
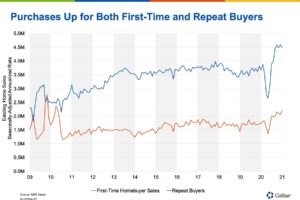
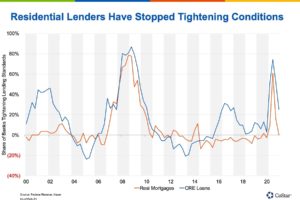
Data was released last week for a variety of residential housing indicators: housing starts and building permits, as well as sales of existing homes, in January. We will have to wait for new home sales data on Wednesday of this week. Residential construction was one of the consistent bright spots in an otherwise challenging 2020, contributing a positive 0.2% to gross domestic product while the economy shrank several percentage points overall. And while new housing starts were lighter than expected in January, they remain at levels not seen in nearly 15 years. Building permits, a better indicator of future supply, spiked to their highest level since 2006. That same statistic is true for existing home sales as well. Let’s get into that chartbook. Below, we’ve fit a lot of data on one chart, so take your time with it. We are looking at non-seasonally adjusted 12-month totals of new and existing home sales, as well as housing starts, and their percentage increase from a year ago (i.e., pre-pandemic levels). Looking at these key metrics across regions, non-seasonally adjusted total home sales and housing starts are up sharply on a trailing 12-month basis everywhere. Even from pre-COVID levels. It’s safe to say that the single-family housing market is incredibly strong. Granted, we aren’t back to the housing bubble days of 2004-2005, but the current strength is notable for one obvious reason: 2020 experienced a sharp recession. And it looks like this strength is set to continue, for a couple of reasons. Let’s look at them now. The chart below shows mortgage applications filed with intent to purchase, displayed on a calendar basis to make any seasonality visible, from our friends at the Mortgage Bankers Association. We chart this weekly data for the year so far (in green), for last year (in blue) and the average of the four years prior to 2020. As you can see, 2021 is off to a very hot start. In fact, the largest increase in mortgage applications compared to the prior few years was the first week of February 2021, up 40% from what was normal the same week in 2016-19. To us, this seems an obvious result of the K-shaped recovery. Many who can work from home and didn’t face any pay cuts then also saw a cash injection as part of the coronavirus relief package possibly noted that it seemed a good time to buy into more space to accommodate home offices. As a result, the share of first-time homebuyers jumped to 33% of purchases in 2020, the most in a year since 2010. Repeat buyers saw a sharp increase in purchases as well, but after a larger decline during the early days of the pandemic. This suggests more catch-up compared to the steady upward increases in first-time home purchases in recent years. Note the volatility during the surge in first-time homebuying back in 2009-2010, which was the effect of a — questionably timed — first-time homebuyer tax credit. The rise during 2020 and early 2021, in contrast, looks more durable. The reason we feel that this rise is here to stay is that it appears to be a structural, demographically driven change. First-time homebuyers had moved their first purchase age back consistently after the Great Recession, with the median first home purchase age of 33 in 2020, three years older than 2010, and even older compared to the 1990s. And look at which generation is now moving into its peak first-time homebuying years. You guessed it. Millennials, now aged 24-40, are the largest generation ever in the U.S., and are in prime age to begin making home purchases. And this trend should have some legs, as the median millennial is barely 30 years old. Of course, record-low interest rates have had an outsize impact. However, you can’t borrow at these low rates if lenders aren’t willing to lend. And credit conditions had tightened significantly as the country dove into the COVID recession. That tightening of credit shows up in the home sales chart above in those large dips in purchases. Since then, however, the Fed’s Senior Loan Officer Survey indicates that residential lenders have quickly become more comfortable lending and have eased off from tightening credit standards. Based on the chart below, banks are more comfortable lending into the residential housing market than to commercial real estate. All of the conditions are in place for meaningful residential housing growth: demand from a new generation of home buyers, historically low mortgage rates and lenders willing to lend. Will this torrid pace keep up? Probably not, especially with inflation-adjusted interest rates doubling already year to date. But we don’t expect a quick return to pre-pandemic levels either. In fact, with more stimulus on the way to shore up household balance sheets even further, combined with the fact that this was not a balance sheet-induced recession like 2010, 2021 looks like another strong year for single-family housing. The Week Ahead …This coming week we get more housing data! Data on new home sales in January is to be released on Wednesday, likely to show continued elevated single-family housing activity. Home price data is set to come out on Tuesday, including the Case-Shiller home price index and Federal Housing Finance Agency house price index, both for December. But there will be plenty of economic data released throughout the week, in addition. Roughly in order of importance, personal income and spending data for January will come out Friday, with January durable goods orders on Thursday, as well as revisions to fourth-quarter GDP. Income and spending data, in particular, should show a strong January, bolstered by a new round of stimulus checks as well as easing COVID cases. Fed Chairman Jerome Powell, firmly dovish in recent weeks in suggesting the Fed is nowhere close to meeting its goals, is scheduled to testify in front of the Senate Banking Committee on Tuesday and the House CoStar Economy is produced weekly by Robert Calhoun, managing director and senior economist, and Matt Powers, associate director of CoStar Market Analytics in New York City. |
Fort Collins Home Real Estate Specialists. Find new houses, new homes and construction, and Old Town Fort Collins properties.


